Project 2 🛵

Rydan Bike Taxi Analysis || SQL + Power BI

Introduction

In a world where convenience and speed are key, bike taxi services like Rydan are transforming the way people commute. But behind every ride lies a story - of customer behavior, service efficiency, revenue patterns, and operational performance. This project dives into those stories using data as the guide.

The Rydan Bike Taxi Analysis is like a roadmap that uncovers how the business is doing, why customers cancel rides, which areas bring in the most revenue, and how riders are performing. By breaking down data into clear trends and insights, this dashboard empowers decision-makers to understand what's working and what needs a tune-up.

More than just numbers on a screen, this analysis provides a pulse check on the entire operation. It helps the company make smart decisions that improve service quality, boost customer satisfaction, and guide the business in the right direction.

business problem

Rydan Bike Taxi lacks clear visibility into customer behavior, cancellation trends, revenue patterns, and vehicle performance. This limits its ability to make smart decisions that improve customer retention, streamline operations, and drive revenue growth.

Chapter 1: Data preprocessing

Before diving into the dashboards, careful data preprocessing was performed. Unnecessary columns were removed, missing values were handled, and duplicate entries were eliminated. Column names were also cleaned and standardized using Power BI's Power Query Editor to ensure a well-structured dataset for accurate visualizations.

Chapter 2: overall dashboard

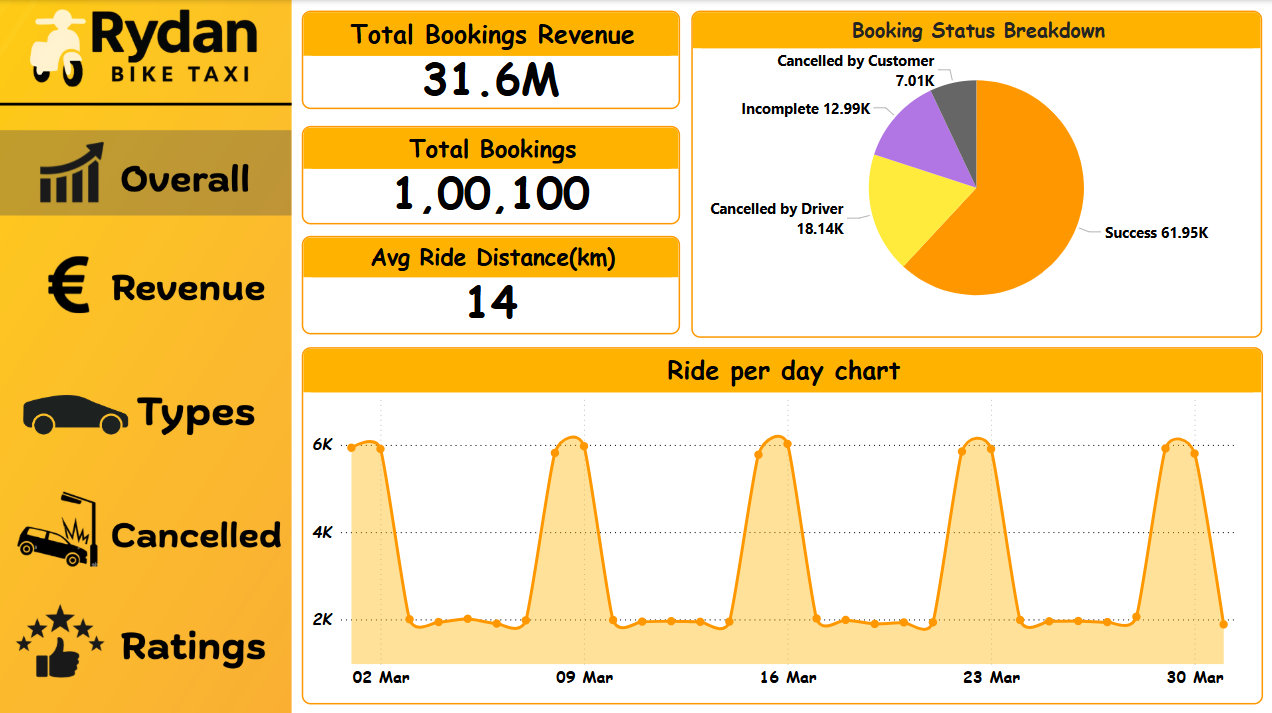
This dashboard gives a quick and easy snapshot of how Rydan is doing. It shows total earnings, number of bookings, and average ride distance. A pie chart breaks down how many rides were completed, canceled, or left unfinished. There's also a daily ride chart that shows clear patterns—some days are super busy, likely weekends or peak days.

Overall Dashboard

Key insights

  • Most rides (about 60%) were completed successfully.
  • Around 1 in 5 rides were canceled by drivers, and some rides didn't finish properly.
  • Ride bookings go up every 7 days, likely on weekends or special days.
  • On average, people travel about 14 km per ride.
  • The app has handled over 1 lakh total bookings - showing it's widely used.

Chapter 3: revenue dashboard

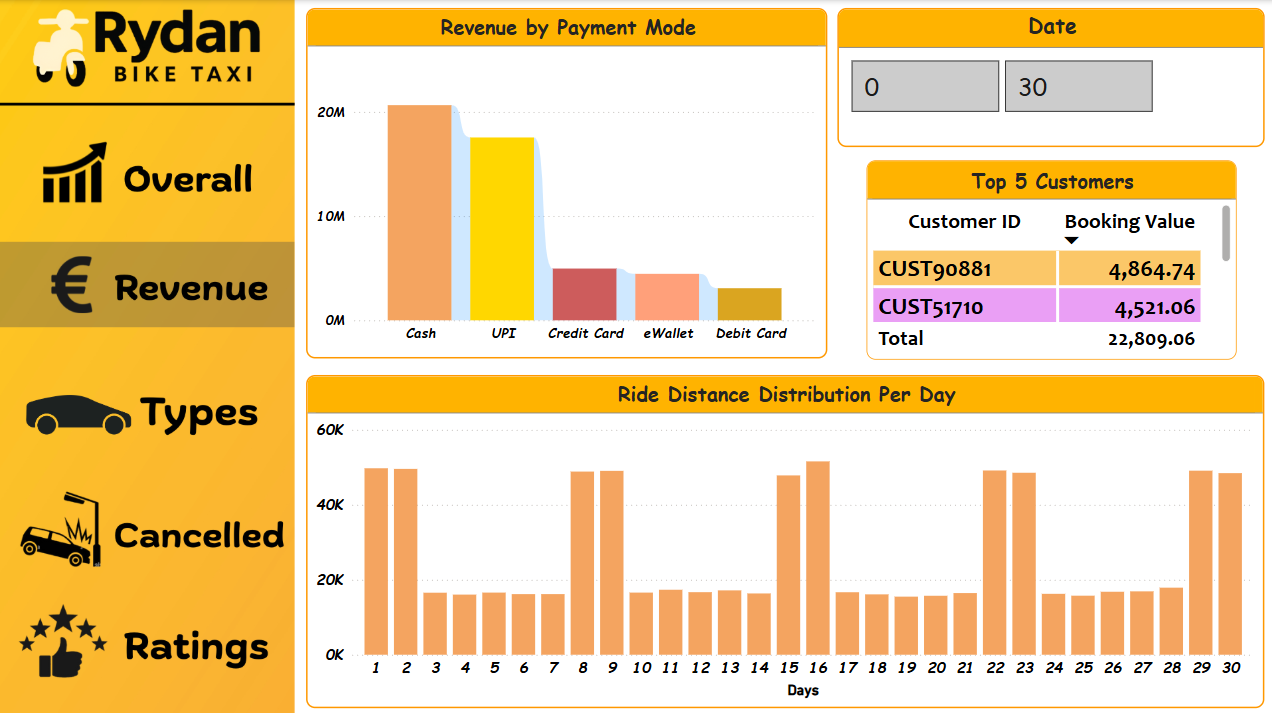
Focusing on financial performance, this dashboard breaks down earnings by payment methods and highlights top-spending customers. It also tracks how ride distances vary across days of the month.

Overall Dashboard

Key insights

  • Most people prefer to pay with cash or UPI.
  • Fewer people use cards or eWallets, which could be improved with offers or promotions.
  • Just the top 5 users spent over ₹22,000 — showing there are some very active customers.
  • Ride distances are higher on certain days, which matches the weekly ride spikes — likely weekends.

Chapter 4: Types dashboard

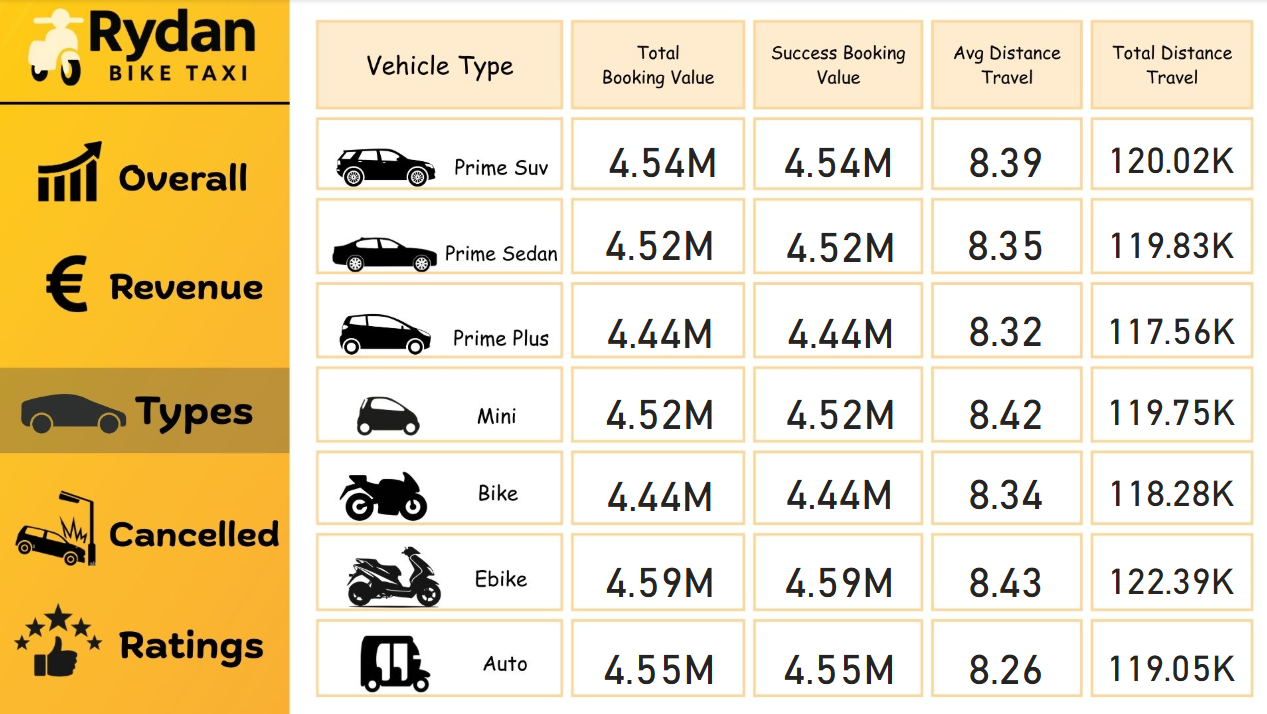
This dashboard focuses on the performance of different vehicle types across key operational metrics. It provides detailed insight into booking value, distance metrics, and customer ride behavior segmented by vehicle category.

Overall Dashboard

Key insights

  • All vehicle types show similar performance in revenue and distance, indicating balanced user demand.
  • Mini cars and Ebikes offer a good mix of trip distance and earnings, suggesting efficiency.
  • Auto rickshaws stand out for strong revenue and usage, proving both popular and cost-effective.
  • The average ride distance is consistent across types, ranging from 8.26 to 8.43 km.

Chapter 5: Ratings & Cancellation Dashboard

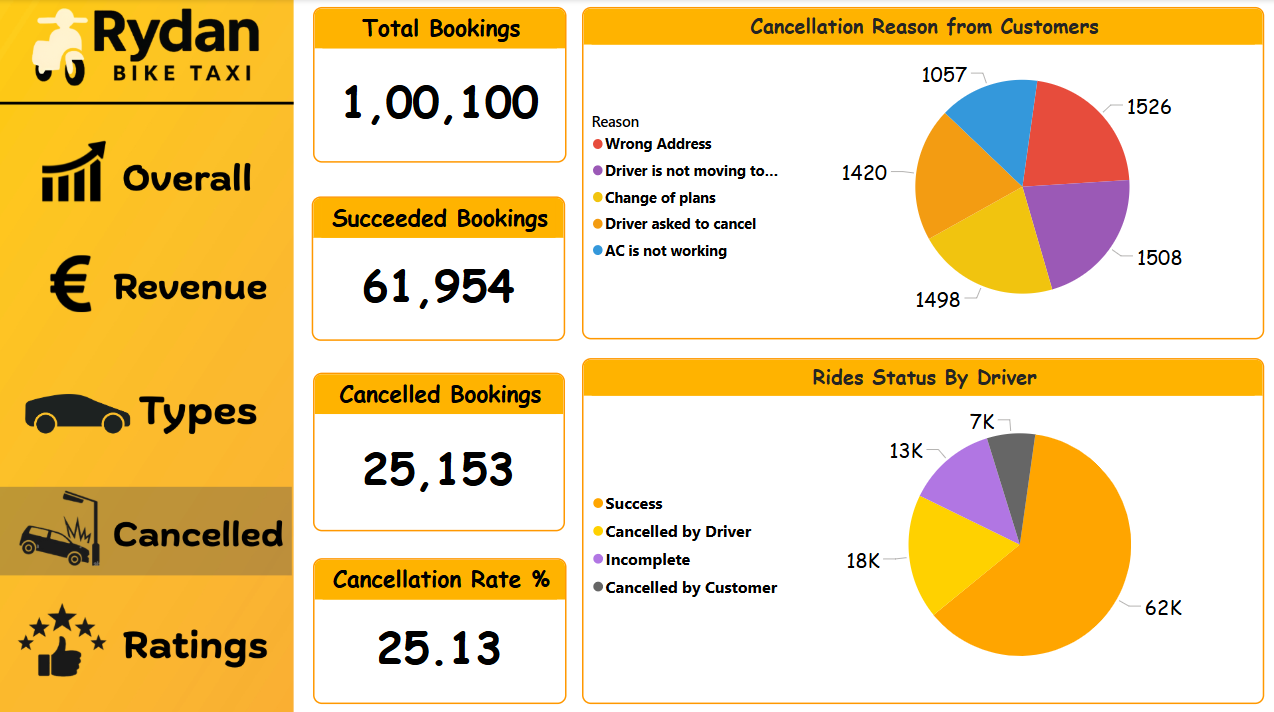
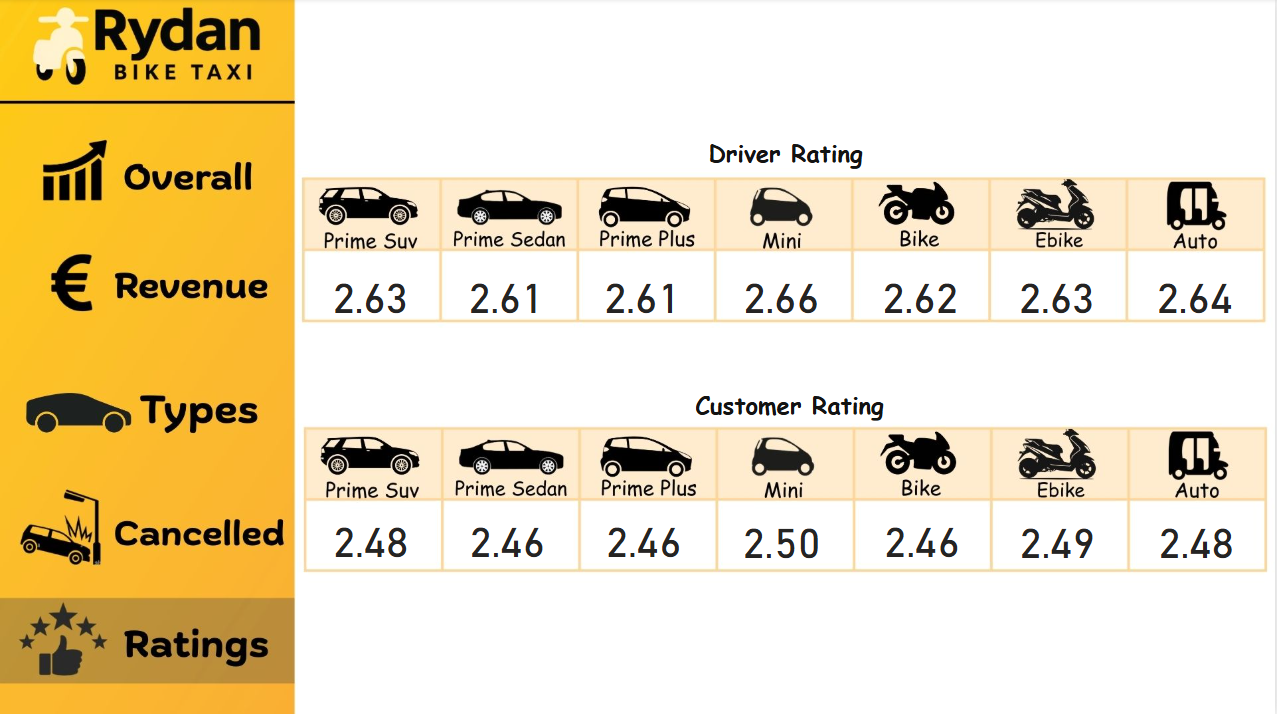
This dashboard captures platform reliability and satisfaction, combining user feedback with cancellation behavior insights. It evaluates both driver and customer ratings as well as the causes and distribution of booking cancellations.

Overall Dashboard

Overall Dashboard

Key insights

  • Mini and Auto have the best driver ratings, showing strong performance in those categories.
  • Customer ratings are lower across the board, with none above 2.50 *suggesting room for improving rider experience.
  • Cancellations are high at 25%, mostly due to drivers and incomplete rides.
  • Top reasons for cancellations include wrong addresses, delays, and AC issues *pointing to app and vehicle quality improvements.
  • There's a clear gap between driver satisfaction and customer experience, especially in premium categories like Prime Sedan and Plus.

Chapter 6: Sql Data Analysis and preparation

Behind the scenes of the dashboard magic, I rolled up my sleeves and dove into over 100k+ ride records using MySQL. I gave the messy data a good cleanup, then crafted smart queries to uncover cool patterns like when people love to book rides, how they behave, and where the money flows. I turned all that raw data into visuals that actually make sense Thanks! to Power BI.

Key insights

  • 🧑‍💼Customer Behavior ~
    🔹Identified loyal customers who made 5+ successful rides with zero cancellations — ideal for reward or referral programs.
    🔹Found that most cancellations occur mid-week, helping optimize driver availability and app notifications.
  • 💰Revenue Trends ~
    🔹Discovered top pickup → drop routes contributing the highest revenue — useful for targeted promotions.
    🔹Analyzed daily and cumulative revenue to support time-series dashboards in Power BI.
  • 🚗Vehicle Performance ~
    🔹Evaluated each vehicle type on average ride distance, booking value, and cancellation rate.
    🔹Ranked vehicle types based on combined efficiency — supporting fleet strategy and pricing decisions.
  • 🛠️Operational Insights ~
    🔹Flagged high-value canceled rides for business attention — helping minimize revenue leakage.
    🔹Calculated and visualized weekly revenue growth, supporting business forecasting.

business solution

To help Rydan Bike Taxi improve its service and grow the business, the following solutions should be implemented

  • 📊Better Visibility ~
    🔹Created clear dashboards to track key metrics and support smarter decisions.
  • ❌Reducing Cancellations ~
    🔹Reduced cancellations by fixing address issues, delays, and improving driver and vehicle quality.
  • 😊Improving Customer Experience ~
    🔹Collected feedback and provided driver training to raise customer satisfaction and ratings.
  • 🎁Rewarding Loyal Customers ~
    🔹Introduced a loyalty program and special offers for top customers to keep them coming back.
  • 💳Encouraging Digital Payments ~
    🔹Promoted digital payments (like UPI and cards) with discounts and easier payment options.
  • 🚗Optimizing Vehicles ~
    🔹Adjusted vehicle availability based on demand, ensuring the right vehicles are in the right places.
  • ⏰Smart Planning for Peak Times ~
    🔹Offered incentives for drivers and adjusted pricing during busy times to maximize revenue.

Result : These actions improved efficiency, higher customer satisfaction, and helped the business grow.

See code here!

Projects🔥

Every dataset has a heartbeat💓 here's how I tune in and make it sing.🎺

Go to Projects🔥

Home🌟

Return to the heart where it all started.❤️

  Go to home🌟